

Following the footy finals, sporting eyes will turn to the upcoming summer of cricket, which this year features the Ashes. To win a game of test cricket, a team requires experience, discipline, patience and consistency over extended periods. It involves knowing when to play and when to leave, when to attack and when to defend. Similar traits are required when it comes to successfully managing a portfolio of investments for the long term.
This summer will also feature an increase in the number of 20/20 games, with a focus on short term excitement through increased risk taking. The comparison of cricket and investing is appropriate. The skills required to generate consistent long-term returns look very like that of test cricket, yet investors are often drawn to riskier approaches. As cricket historians well know, Don Bradman only hit six 6’s in his entire test career, yet holds the highest batting average on record.
The landscape for traditional active fund managers is changing leading to increasing levels of active risk being taken. So, it is important to measure the level of consistency or a portfolio’s ‘batting average’ to ensure risk is taken at the right time, and not just for risk’s sake.
Conviction with consistency
The rise of passive investing along with ETFs is disrupting active management globally. The response in Australia from these pressures appears to focus on taking more risk, to ‘prove’ a differentiation to the index.
To demonstrate this effect, Figure 1 shows the Australian universe of long-only actively managed funds taken from the Mercer Australian Shares Long Only Survey as at June 2007. Figure 2 shows the same survey, 10 years later at June 2017. Funds are ranked by return (y-axis) and level of active risk (tracking error (x-axis)).
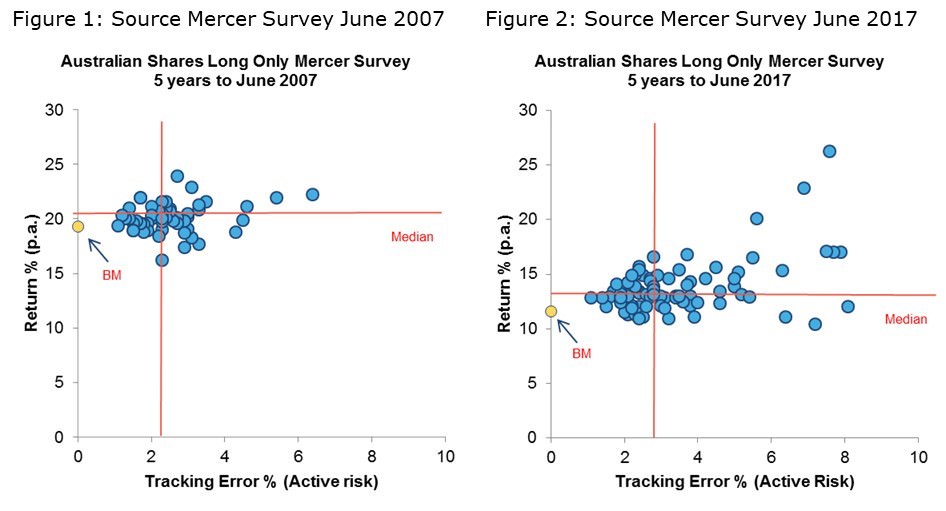
In 2007, only 20% of long only funds recorded a tracking error (active risk score) greater than 3%. Ten years on, 45% of active managers in the survey are taking on active risk above 3%. Managers appear to be responding to the pressure to deviate returns away from benchmark.
For higher ‘risk’ mangers with higher tracking error above the median (shown in figure 2), there is material dispersion in performance for the same level of risk. On average there appears minimal additional return for some very high levels of risk.
Relevancy of active risk
Active risk can be increased in a portfolio in a number of ways: greater concentration via a reduction in the number of stocks held, large sector tilts, unconstrained cash positions and holding companies which have different risk profiles to the benchmark.
Increasing active risk in a portfolio can result in spectacular differentiated short-term returns. However, the increased risk can lead to greater drawdowns (losses) and prolonged periods of underperformance as well. To continue the cricket analogy, a six, six, four in 20/20 is often quickly followed by a ‘W’ in the wrong column. True, we need to take some risk to get returns, but sometimes risk just equals risk.
Investors should consider approaches that can balance the higher returns expected of a more concentrated portfolio with the level of risk or volatility needed to achieve those returns. Good portfolio management is far less about how much risk you take and more about knowing when to take the risk
Consistency in return prevents large behavioural biases of buying a star performer right at the top of a cycle or losing faith in the approach just at the wrong time. A consistent return series is also more practical for an adviser managing a large client base with multiple investment time horizons.
Ways to measure portfolio consistency and skill
The following are some techniques to monitor the consistency of an investment portfolio over rolling or extended periods rather than short term point in time periods, used in conjunction with analysis of the investment rationale behind the outcome:
- Batting average is the total months a portfolio has outperformed divided by the total number of months in a given period. For example, if a portfolio has outperformed six months over a year it has a batting average of 50%. Consistency of batting average over time results in a smoother return series.
- Hit rate shows the number of correct individual stock decisions as a percentage of the total number of manager decisions. Maintaining a consistent hit rate over 50% indicates solid investment skill.
- Win/loss ratio is a comparison of the alpha generated from the good decisions with the alpha lost from poor decisions. For example, 0.75% excess return in outperforming months versus 0.70% excess loss in underperforming months leads to a ratio of 107%. Sustaining a positive win/loss over extended periods indicates consistency and skill.
- Information ratio (IR) takes the excess return divided by the active risk i.e. how much return you can achieve for each unit of risk taken. An IR that can consistently remain above 0.5 is seen as a good risk return outcome. Anything consistently above 0.75 implies a high level of skill.
Risk matters
Risk management is central to successful funds management. Using a long-term approach with a level of consistency in returns provides comfort that investors will achieve their objective, irrespective of timing. It may not be as exciting as a 20/20 match, but will provide a superior risk-adjusted return over the longer term, help avoid succumbing to behavioural biases and ensure a smoother ride to your destination.
Author: Andrew Martin, Portfolio Manager
Originally published in Firstlinks.