

Fortescue is the fourth largest iron ore producer in the world, operating in the Pilbara in Western Australia. It was founded by Andrew Forrest in 2003 and has grown with the increasing demand for iron ore from its customers, mainly in China. Its main competitors are Vale, Rio Tinto and BHP however Fortescue’s ore is of lower quality (with 58% iron ore versus 62% of its rivals).
Why had Fortescue’s share been underperforming from early 2017 till end of 2018?
President Xi Jinping’s commitment to clean up China’s polluted skies and address steel mills poor profitability through closure of excess capacity, has resulted in an uplift of steel mill capacity utilization and profitability, and with it an increase in demand for higher quality ore. This has pushed Fortescue lower grade discount vs 62% benchmark from 10-15% in 2016 to as high as 50% in 2018, thereby considerably reducing Fortescue leverage to the benchmark price. The market has been questioning whether this new discount level is structural or cyclical, and in doubt is assuming the former.
Figure 1 – Iron Ore Quality Spread – 62% to 58% (as % 62%)
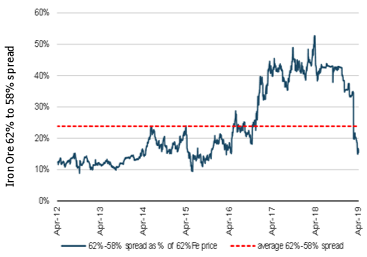
Source: Bloomberg as at May 2019
When and why did we take a position in Fortescue?
We regularly visit China to gain insights on the demand for iron ore and other raw materials. The visit in November 2018 suggested that the economic outlook would continue to deteriorate over the winter. This would likely force the Chinese government to stimulate the economy to reach its ‘stable growth’ goal through once again pulling the levers of infrastructure and housing, but in a more targeted and controlled manner. Such actions would eventually lift the demand for iron ore and support its prices. In the meantime, steel profitability was under pressure, and mills for the first time in a while started adding lower iron ore mix to their feed, an important change of preference for Fortescue. It didn’t take long for the iron ore discount to start narrowing, yet the market was not fully convinced.
We initiated a new position in Fortescue in January 2019 on the view that the market was mispricing the discount, and that the market had also become too negative on China’s steel outlook for 2019. Fortescue was about to benefit from both a narrowing of the price discount and a lift in the iron ore price. When the position was taken, applying the spot prices and discounts was leading to a Net Profit After Tax (NPAT) of $2bn, double the $1bn expected by the market.
When the tragic collapse of one of Vale’s Brazilian tailing dams occurred, it became clear that a significant supply disruption was about to occur for 1-2 years, further supporting the outlook for iron ore prices. We added to our position.
Figure 2 – Iron Ore Prices (US$/t, CFR China)
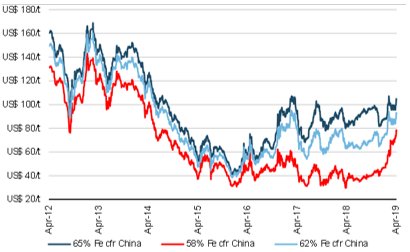
Source: Bloomberg as at May 2019
Why we continue to hold Fortescue as well as Rio Tinto and BHP
We bought Fortescue at around $4.5 in January 2019 and it rose to over $8 a share by April 2019, during which time the iron price had risen from $75 to $85 a tonne. A follow up visit to China in March 2019 highlighted that significant additional upward pressure was still about to materialize. The mills, who had chosen to run down their inventory in the lifting price environment, had under-estimated the supply disruption and were now forced to re-stock. The price is now $95 a tonne and we would not be surprised if it continued to lift further. The market expectations for 2019 have been increased but only to $80 a tonne which we think is too low.
The recent decision to push through the development of its high quality 67% Bridge Magnetite Project will allow Fortescue to blend and lift the grade for half of its production, effectively putting the company in a position to be able to control its realized price by optimizing its iron ore mix depending on the quality discount. In our view an astute investment!
We believe earnings are likely to continue to materially surprise on the upside but will continue to monitor expectations, supply response and of course valuation to decide when to trim or exit our position.
Figure 3 – Earnings Revisions for Fortescue (A$/share)
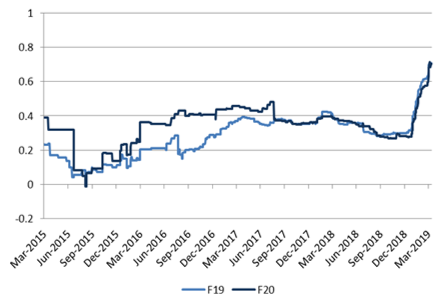
Source: Bloomberg, Alphinity as at May 2019
Figure 4 – Fortescue active weight and alpha
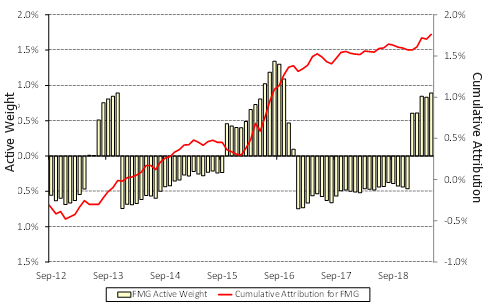
Source: Bloomberg, Alphinity as at May 2019
Author: Stephane Andre, Portfolio Manager